
The Nifty50 witnessed a stellar 8% move from 21,964 to 23,700, changing sentiment from fear to hope. The fast and furious reversal potentially indicates the resumption of the trend for investors. But for traders is this an opportunity to book profits on leverage longs?
“Success in trading isn’t about hitting the home run every time, but about consistently booking profits, one small step at a time.”
While some may argue that a trader should ride the rally, we have a reason to book profits.
The 13-week Fibonacci time cycle theory signals a reversal or a pause in momentum in the next week while the 13-day Fibonacci Time cycle signals a reversal or a pause in momentum on 27 March 2025.
Consider +/—2 days. A reversal or pause in momentum can be expected between 27th March – 2nd April. Being a trader, it is important to take profits off the table.
2. Market Breadth
The Golden Cross and Death Cross quantifiably defines the bullish and bearish trends on the charts. The Golden Cross is Bullish when the 50 DEMA is above the 200 DEMA, and vice versa for the Death Cross, which is Bearish.
- On Nifty50, 34 out of 50 stocks are still in the death cross, which means 68% of stocks define the bearish market breadth.
- On a broader market, the Nifty500 still shows that the bears are in control, as 78% of stocks are in death cross.
There’s something for the Bulls Too…
On the daily chart, the index has broken out of the falling trendline at 23,200 and rallied to 23,700.

In technical analysis, retests are considered the strongest breakouts, and if a reversal occurs, a retest of 23,200 may be on the cards.
The recent hurdle at 23,700 on the chart and 24,000 as per the Open Interest indicates the bulls may be tiring in the zone.
Here are three potential F&O stocks that have potential bearish setups…
- Indus Ind Bank
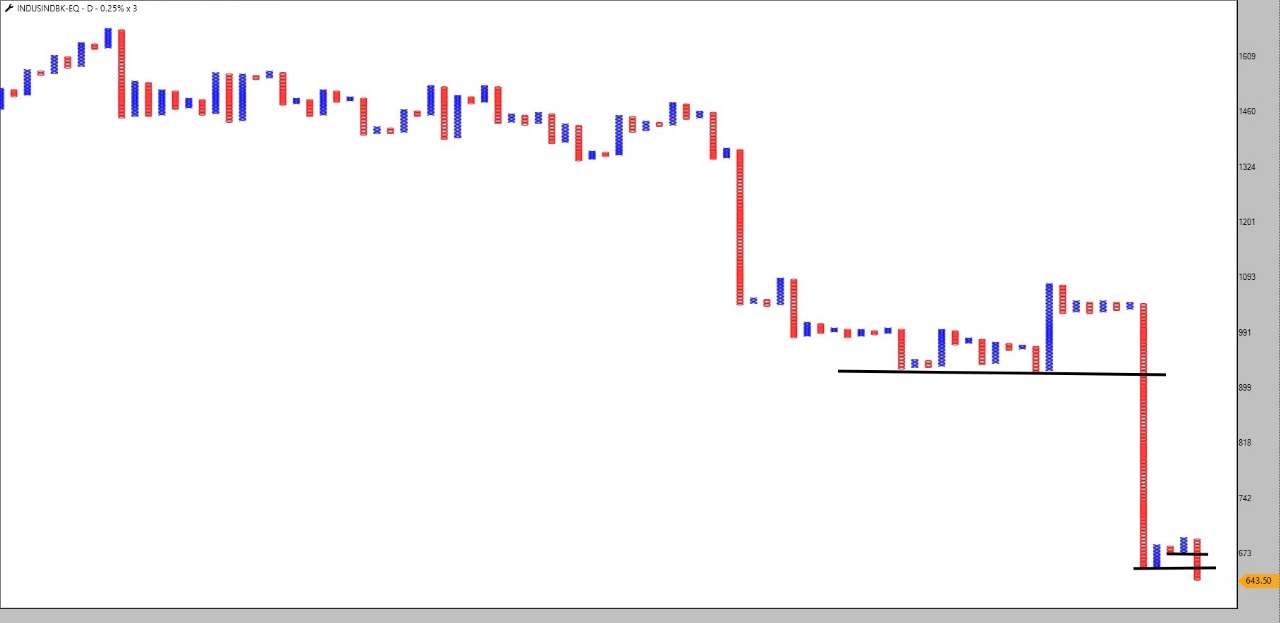
The stock price of IndusInd Bank broke down from the previous base after the recent gap-down. The follow-up from the anchor column signals the bears are still in control of the potential bearish trend.
The traders can look for the current rise as a potential short opportunity in the F&O April series.

In case of Colgate, support breakdown followed by a bearish anchor column on the P&F chart indicates the potential bearish trend.
The breakdown from the four-column triangle signals the resumption of the potential bearish trend.

On the daily chart, the series of bearish breakdowns and a bearish anchor column suggest that bears control the trend.
The current bearish anchor column could resume below 2,800, and F&O traders can seize this opportunity.
Traders, stay agile! The market never stops teaching.
Disclaimer:
Note: We have relied on data from throughout this article. Only in cases where the data was unavailable have we used an alternate but widely used and accepted source of information.
The purpose of this article is only to share interesting charts, data points and thought-provoking opinions. It is NOT a recommendation. If you wish to consider an investment, you are strongly advised to consult your advisor. This article is strictly for educative purposes only.
Brijesh Bhatia has over 18 years of experience in India’s financial markets as a trader and technical analyst. He has worked with UTI, Asit C Mehta, and Edelweiss Securities. Presently, he is an analyst at Definedge.
Disclosure: The writer and his dependents do not hold the Stocks discussed in this article. However, clients of Definedge may or may not own these securities.
The website managers, its employee(s), and contributors/writers/authors of articles have or may have an outstanding buy or sell position or holding in the securities, options on securities or other related investments of issuers and/or companies discussed therein. The articles’ content and data interpretation are solely the personal views of the contributors/ writers/authors. Investors must make their own investment decisions based on their specific objectives, resources and only after consulting such independent advisors as may be necessary.